Data Presentation Basics
The Gauge dashboard item displays a series of gauges. Each gauge can communicate two values - one with a needle and the other with a marker on the scale.
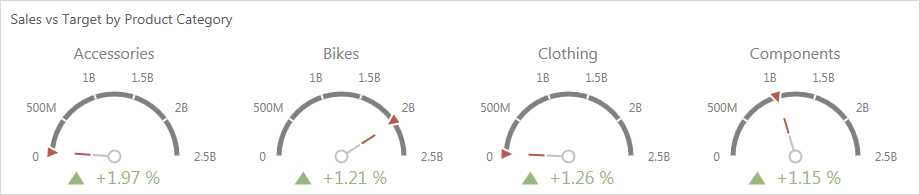
The Gauge dashboard item can illustrate this difference for various sets of values. You can switch between these sets using the Values button (the  icon) in the gauge's caption.